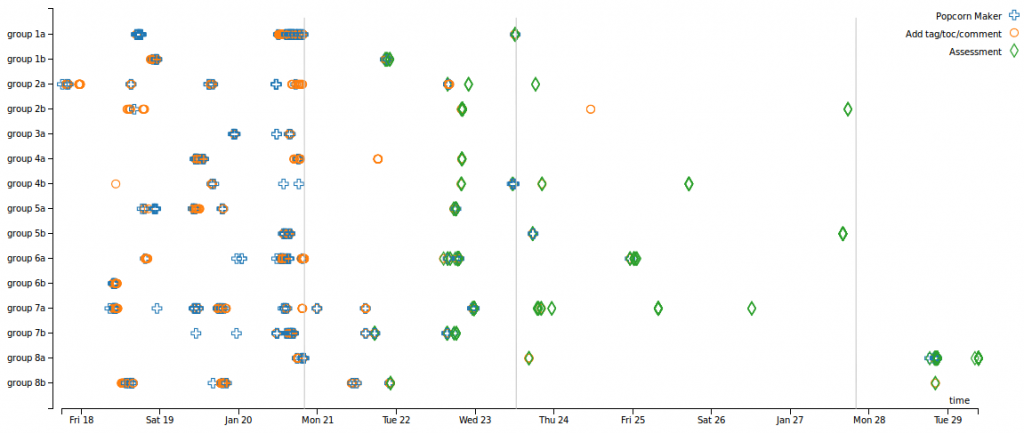
CORDTRA stands for Chronological-Ordered Representation of Discourse or Tool Related Activity. These diagrams consist of a timeline where multiple processes are ploted in parallel. Basically it is scatter plot where activities follow a certain coding scheme. In my example the usage of video annotations was distinguished into different interactions, e.g. using Popcorn Maker or direct annotation authoring or contributing/starting an electronic assessment (quiz). The input data was captured in a logfile containing activity data together with a unix time stamp.
CORDTRA diagrams can be used to
- count the frequency of an activity,
- identify patterns of sequential or parallel activities,
- compare different groups by their activity (and inactivity),
- monitoring CSCL activity or group performance in real time.
Realisation with D3.js
D3.js is a flexible javascript library that renders scalable vector graphics for the web. Especially non-standard, interactiv diagrams and info graphics can be build from a scratch or upon existing expamples. There are numerous examples available that almost well documented for individual adoptions. The code provided here has been sticked together from different sources and tutorials. It is provided as is due its easy extensibility. The data is loaded from a tab separated file (.tsv) containing the columns ‘group’, ‘time’ and ‘activity’. The first and latter is represented as a number while the time is formatted as unix time. Each group is plotted horizontal on parallel axis. On the x axis the time is displayed as date. Activities are coded as coloured symbols on the group axis. Further more a legend of the activities was added in the top right corner.
The code is available here.
Resulting CORDTRA Diagram

Literature
- CindyE. Hmelo-Silver, Rebecca Jordan, Lei Liu, and Ellina Chernobilsky. Representational Tools for Understanding Complex Computer-Supported Collaborative Learning Environments. In Sad-
hana Puntambekar, Gijsbert Erkens, and Cindy Hmelo-Silver, editors, Analyzing Interactions in
CSCL, volume 12 of Computer-Supported Collaborative Learning Series, pages 83–106. Springer
US, 2011.
My Blog – Outstanding work! I’m impressed.
Contact Me here – Your insights are always on point.
Так называемая нейросеть-раздеватор — это цифровая система на базе ИИ, которая обрабатывает визуальные данные.
Она использует методы машинного обучения для модификации изображений.
Работа таких систем основана на распознавании форм.
Подобные нейросети привлекают внимание в контексте быстрого прогресса алгоритмов.
бот раздеватель
При этом важно учитывать границы допустимого и защиту личных данных.
Работа с подобными инструментами требует ответственного подхода.
Многие эксперты подчёркивают, что важно соблюдать нормы и правила.
В итоге, нейросеть-раздеватор является частью современного технологического ландшафта, который нуждается в внимательном отношении.