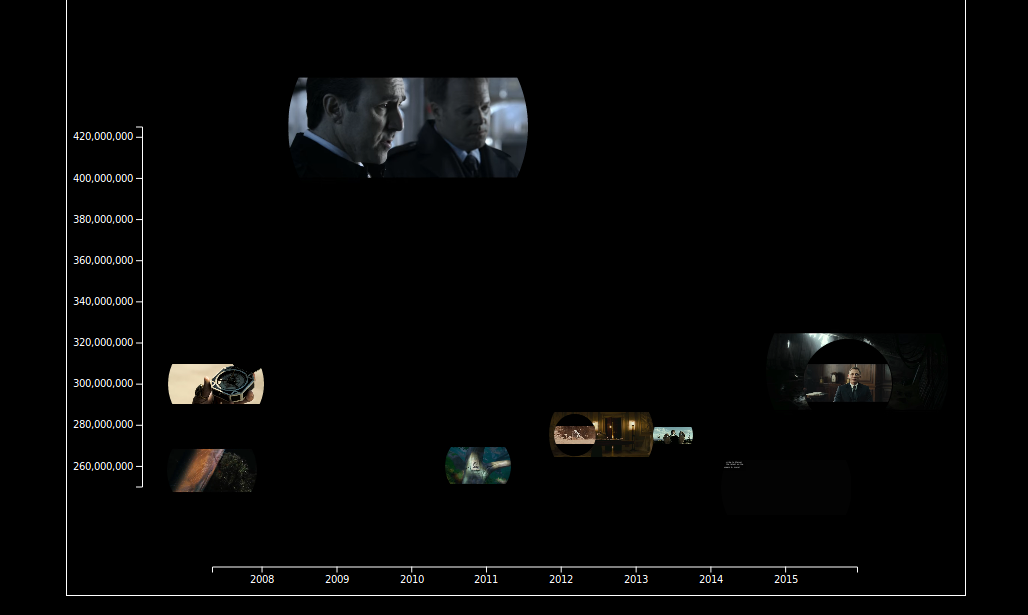
Three guys from ac-d3 published some neat plugin for D3.js for integrating audiovisual content (AC) into data charts (D3). The videos are obtained from YouTube or Vimeo to illustrate the chart content. Presenting and playing multiple videos at once might make no real sense, but it is nice to see some moving images within a bubble chart. So one could use it as tool for remixing different videos into a collage or for more serious data analysis task regarding videos. I am still waiting to see more meaningful example. Unfortunately the browser struggles under the load of simultaneous playing videos. Without this performance problems AC-D3 would be candidate for the Video Learning Dashboard that I am developing at the moment.
The AC-D3 code is available at github.